
Prelude
Before we dig in, we should get a bit of etymology out of the way. The word "prelude" comes from the Latin words "pre" — which means "before" — and "ludere" — which means "play". If Latinate words were not so fashionable, this section could have been titled "foreplay". If all you take away from this piece, hypothetical reader, is that prelude equals foreplay, we will consider it a great success.
Recent explorations have taken us to metaphorical lands that we have not seen in fifteen years — maybe longer. The fifteen-year journey began with simple programming (Haskell if such details interest you), which then took a turn into systems programming (C and POSIX) — this was an era before Rust, where the compiler never held your hand and occasionally threw a tantrum — which was followed by a leap into distributed systems (implementing a datacenter control-plane and durable storage using microservices), and we have — in the last year or so — ventured into complex, dynamic systems.
Almost every segment of that journey, you will notice, involved some kind of system. A system is any set of discrete components, whose operation influences the operation of at least one other component, making the system greater than the sum of its parts. The interesting pattern in this journey, hypothetical comrade, is that each successive journey-segment required that less time be spent modifying the system, and more time be spent thinking about the system. This is because modifying the system is either impossible or is otherwise counter-productive — modifying the system under inspection often times changes its behavior, resulting in confusion instead of clarity.
In the first segment, the Haskell programs were largely computationally pure, and perfectly serial — any source of noise or randomness would have to be introduced by the programmer deliberately. In the second segment, there was a great deal more complexity involving memory allocation, and book-keeping around pointers, but the complexity (and headaches) could increase by a significant factor as soon as multiple threads of execution were thrown into the mix — this is where careful thinking and planning began to pay bigger dividends than staring at the output of a debugger. The third segment required a completely new way of thinking, with much more effort being put into understanding the "laws" of distributed systems — the CAP Theorem, monotonicity, set theory, and semi-formal methods like TLA+.
The latest segment has, in a way, taken us full circle. The systems under inspection are — on the one hand — distributed, but are — on the other hand — extremely sensitive to the incentives and actions of masses of anonymous people on the internet. The only way to understand their behavior over longer periods of time, or at larger levels of adoption, is to model them in a purely simulated environment. We are using a system — namely cadCAD from BlockScience — with the neatness and computational purity found in segment one, to understand and reason about the large and messy systems of this latest segment. Put differently, we are using music to understand and reason about noise.
One Red and One Blue
To illustrate how the metaphorical music can help us reason about the metaphorical noise, we are going to use a very simple model representing the acceptance and adoption of two competing sets of technologies — or practices, languages, customs, and so on — by a pool of users. We symbolically designate each of these sets of technologies as "Red" and "Blue". These sets represent a distinct technological continuity. It could represent an entire line of technological products, the technological outputs of two companies, or of two technological traditions. An example of the first continuity would be the ongoing competition between Android and iPhone, an example of the second continuity would be the decade-to-decade outputs of Apple, Microsoft, and IBM, and an example of the third continuity would be the transition of Japan Steel Works from samurai-swords, to WW2-era, 46-cm gun-barrels, to modern-era unitary nuclear containment vessels. Lets take a look at a graphical representation of the model.
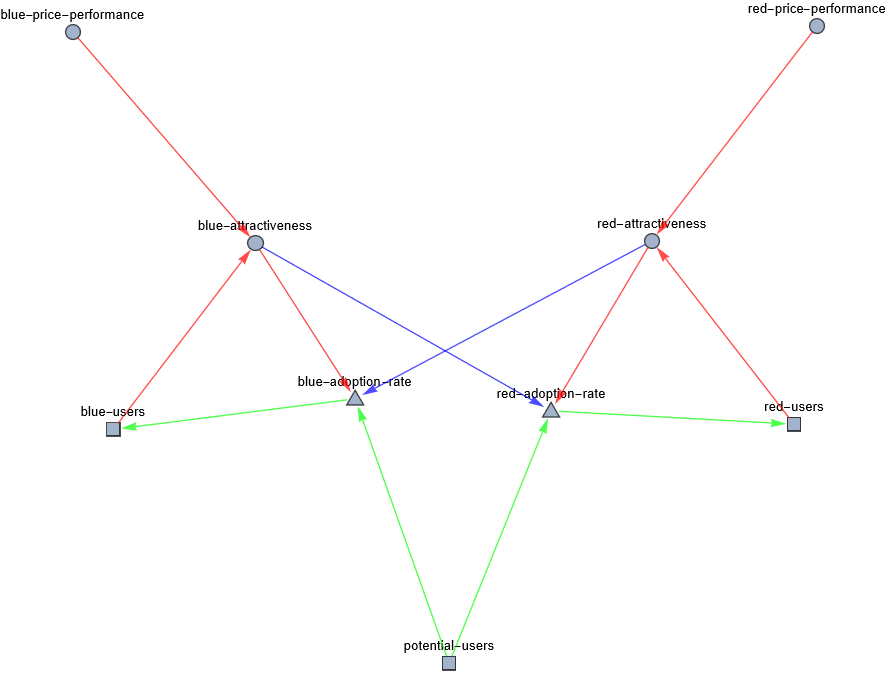
This is a simple model, with only 9 variables and 12 relationships — variables are shapes and relationships are lines. A square is a stock that represents a finite quantity of any countable entity. A triangle is a flow-rate that regulates the flow of quantities from one stock to another. A circle is an abstract number that can represent any abstract notion numerically. Red arrows and blue arrows represent correlation and anti-correlation, respectively. The correlation-arrows can only point to circles and triangles, but can emanate from any shape.
The first thing to notice about this model, is that there are 2 flows leading from potential-users to blue-users and red-users . This implies that the user-pools can only fill, but can never deplete. This is done for the sake of simplicity. We can think of it as the equivalent of product lock-in — easy to acquire new users, almost impossible to convert existing users. Which is not too far from reality — many people keep their old console or gramaphone around to play the media that only still work on those systems.
The second thing to notice is that each technology-set has a price-performance variable and an attractiveness variable. The price-performance variable represents the perceived performance per unit-price. It is computed via a simple dice-roll, and can have any value from 1 to 16. If you think about it, a lot of things have to go right, in the real world, for favorable price-performance perception — engineering has to be top-notch, marketing and sales have to be persuasive, customer service has to calm angry customers, and so on. The attractiveness variable represents a composition of price-performance and the installed-base of the technology — in many cases, having more users may be more important to future users, than the raw price-performance of the product (i.e. people that choose to speak English, instead of, say, Hungarian or Esperanto, usually make this choice because of who speaks English, rather than how expressive or precise or poetic the language is, in comparison to the others).
What If?
Most of us are familiar with statistical models — models that quantify a sample of observed events, and try to assign probabilities to the future occurrence of events. These models are like black boxes — we understand their behavior only by relating their input-values to their output-values. Black-Box-Models are useful, but they are not as interesting as causal models — models that directly represent causal relations between various internal values. A causal model is like a transparent box — in addition to inputs and outputs we can observe and manipulate the internal mechanisms that translate inputs into outputs. This allows us to ask a wide range of what-if-questions that are only possible at small-scales in a black-box-model (i.e. you cannot empirically ask how much thrust you would need to reach outer space if gravity was five times stronger, because we cannot change the gavitational force of our planet).
The technology-acceptance model has a few knobs — called parameters — that we can turn, in order to ask what-if-questions. These parameters are not visible in the previous graph, but they involve:, adoption-threshold , adoption-sensitivity , skill-multipliers . The adoption-threshold represents the minimum number of users needed for network-effects to start working their magic. The adoption-sensitivity represents how strong the network effects are. The skill-multipliers represent the each team's ability to amplify the value of a dice-roll (i.e. a skill-multiplier of 20% can turn a rolled 5 into a 6).
We want to know, how does the model behave with zero network-effects and with zero skill multipliers, as a base-line, and then we want to see how changes in the parameters change the behavior of the model. Here is a run of this base-line-model.
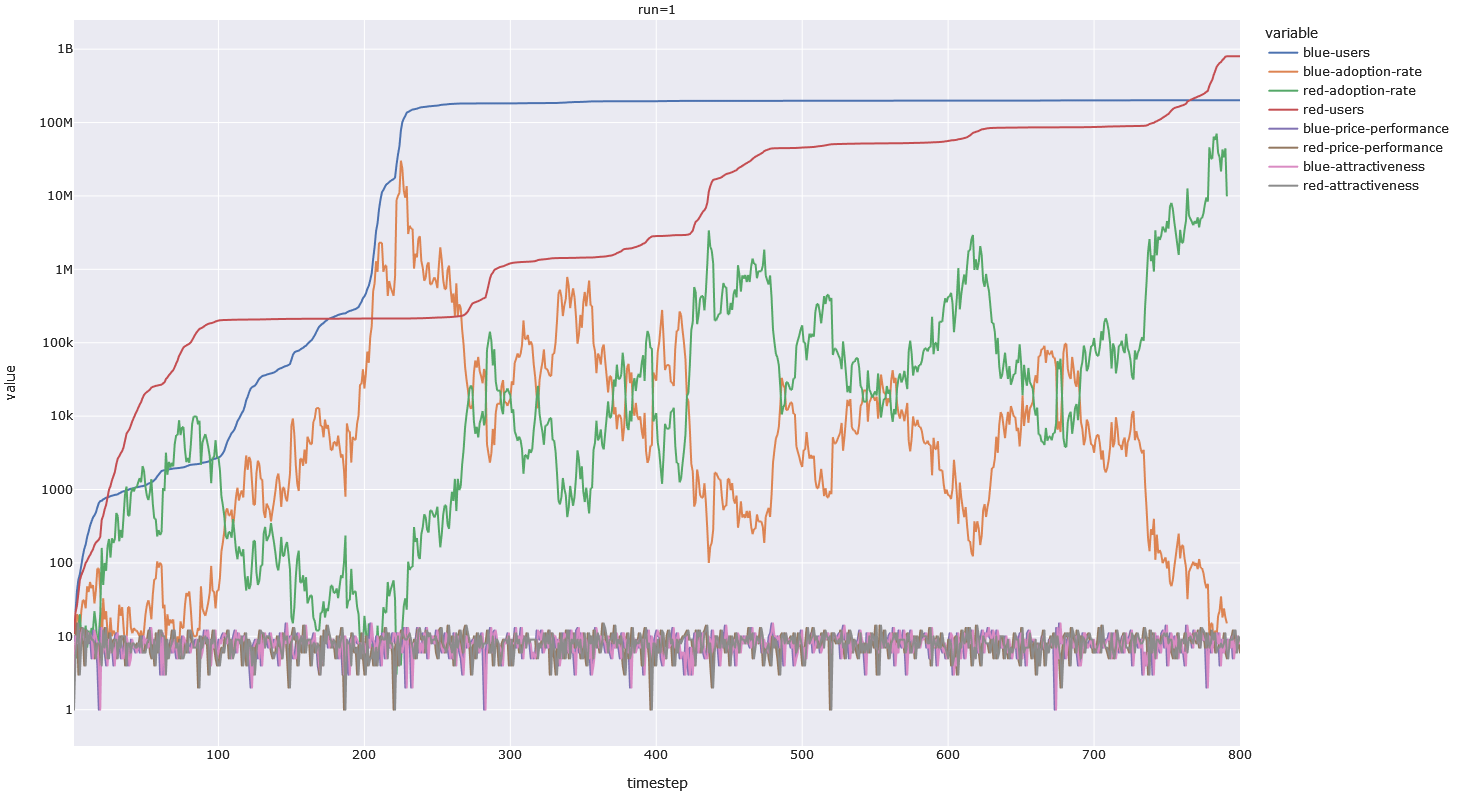
This run — which does not have network-effects or skill-advantages — is based entirely on the dynamics of how dice-rolls affect flow-rates. If Red rolls a 2 and Blue rolls a 1, then the flow of users in into the red pool, is multiplied by 2, while flow of users into the blue pool is multiplied by 0.5. The best case outcome for a player is to roll a 16, while the opponent rolls a 1 — inflow grows by 16 times for the winning player, while inflow shrinks by the same proportion for the losing player. These sharp changes in adoption-rate are not necessarily unrealistic — consider the likelihood that backwater European nations would adopt and perfect the gunpowder artillery technologies before the East Asian civilizations that had a half-millenium head-start with the technology (the Europeans had walls that were much more vulnerable to cannons than the East Asians, who had perfected the building of walls with rammed-earth construction techniques, making early cannons an expensive and ineffective technology — the European cannon-makers got a good roll).
The practical effect of this is that changes in adoption-rate are usually mild — resulting in stagnation — but sometimes quite dramatic — resulting in temporary exponential growth. This gives the system both momentum and inertia.
What If Talent?
Now lets ask what happens if we allow for skill-multiplication — the ability to turn your luck into slightly better luck. Here is a run that includes skill-multipliers of 1.03 and 1.1 for each of the teams — along with our neutral run in the bottom-right corner.
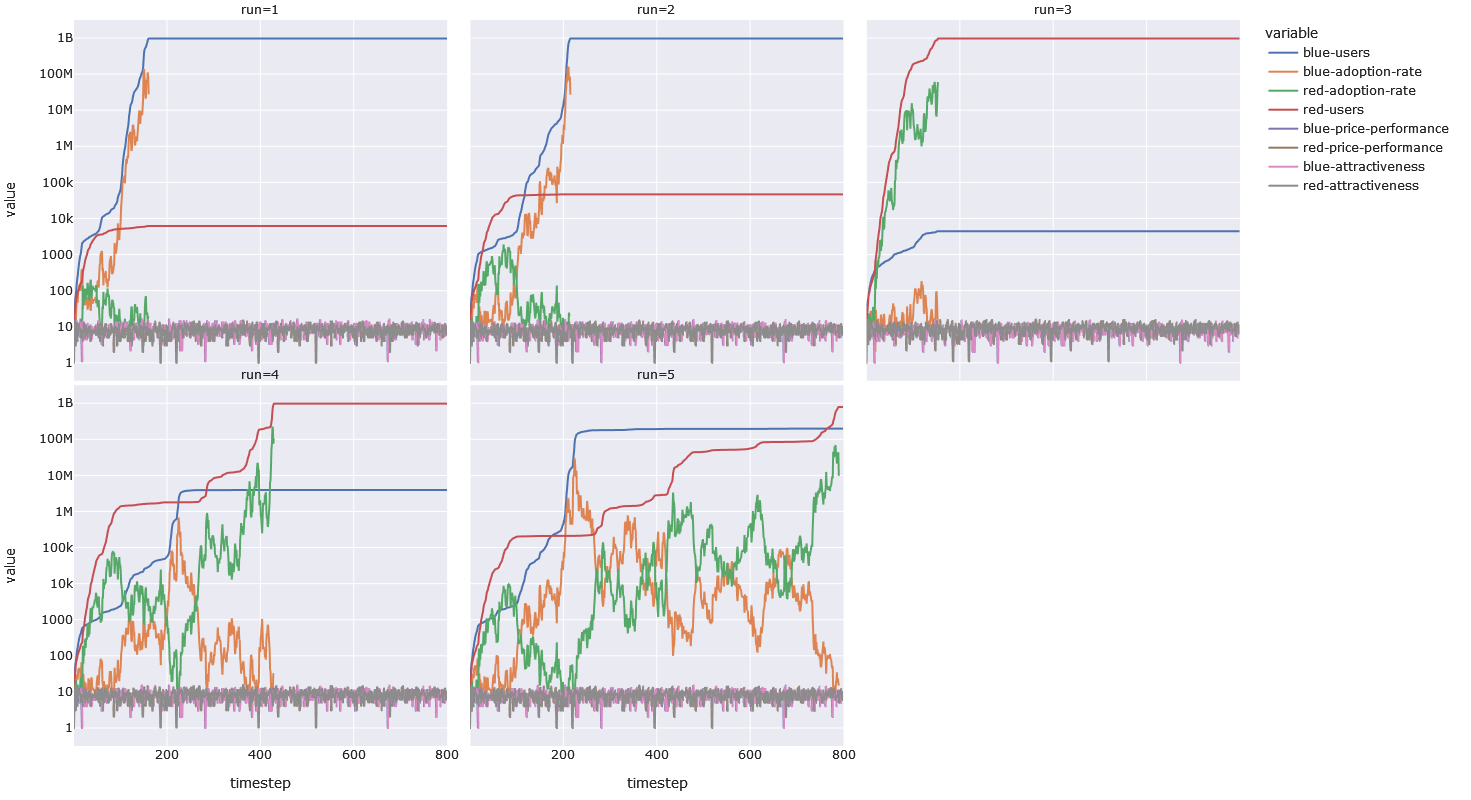
What we see here is that even a slight, durable advantage of 3% can skew the results in the favor of one team. What effectively happens in the model, is that the team with a 3% or 10% edge, can widen a favorable delta, narrow an unfavorable delta, and turn a tie into a favorable delta. When we reduce the advantage to 2% or less, the results are not so clear-cut — on some runs, some of the graphs looks similar to the neutral bottom-right graph.
All of the runs, by the way, use the same random seed, which means that the only thing that is different from run to run, is the skill-multiplier — all the dice-rolls are the same, roll to roll. The lesson for the players of this kind of game, without network effects, is to invest in and accumulate small advantages, and to beware an opponent that already has an advantage.
What If Network Effects?
Let us take a look at what a run with network-effects (but without skill-multipliers) looks like. Just like last time, the base-line run is in the bottom right corner.
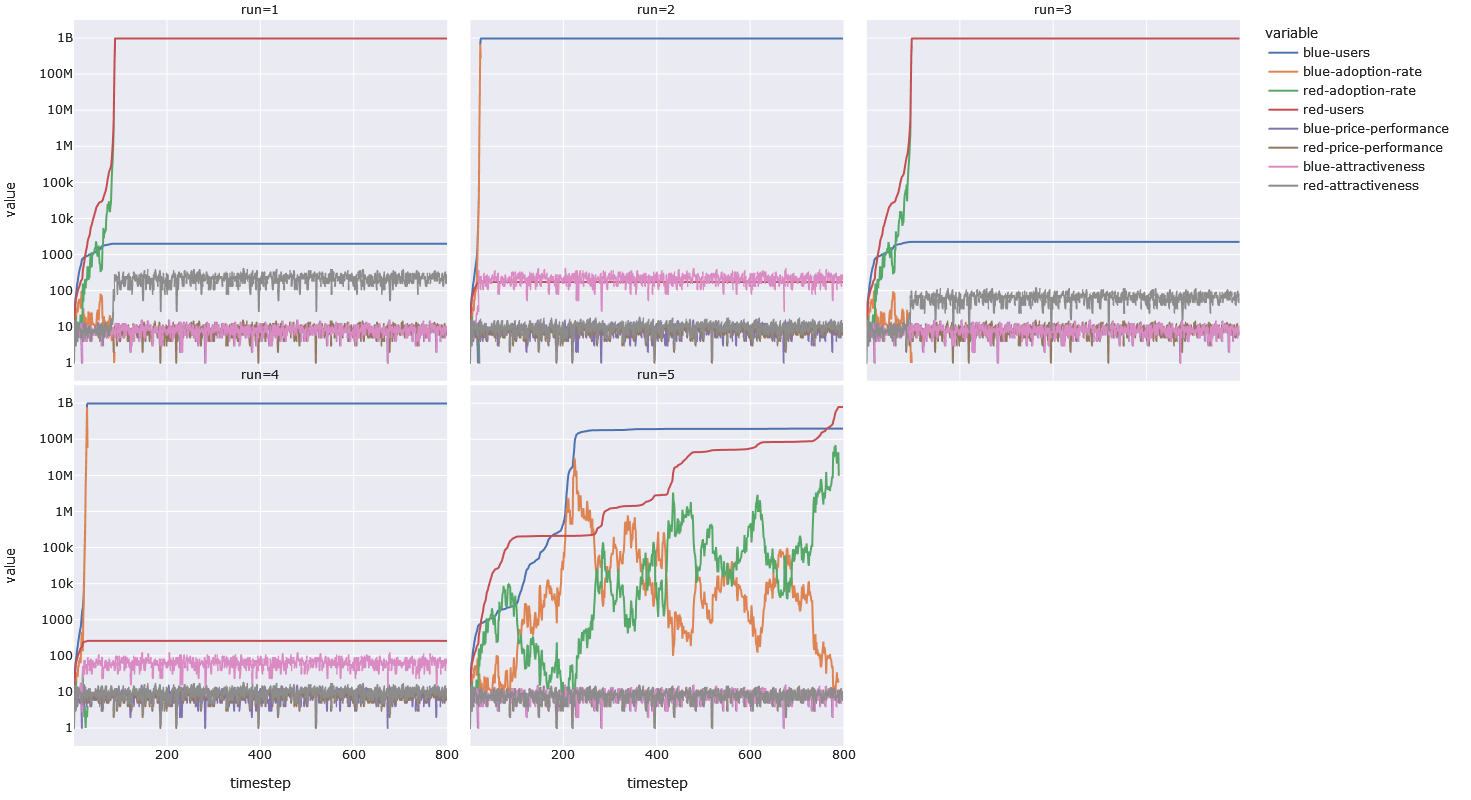
We can see that in every run that involves network effects, the run ends (by empying out the initial pool of one billion potential users) in a fraction of the time that the base-run takes. In half the network-effect-runs, Blue wins, and in the other half Red wins. In the runs with a blue winner, we have a lower adoption-threshold — namely 1000 — and in the runs with a red winner we have a higher one — namely 1000000. The reaching (and crossing) of the threshold is not a binary event — getting closer to the threshold continuously improves your advantage, because we use the following formula as a multiplier: compat-sensitivity^(users/threshold) . If the threshold is 1000 and the sensitivity is 2, a user-base of 600 will give you a multiplier of 1.5. A threshold of 1000000 will give your user-base of 600 a multiplier of 1.0004.
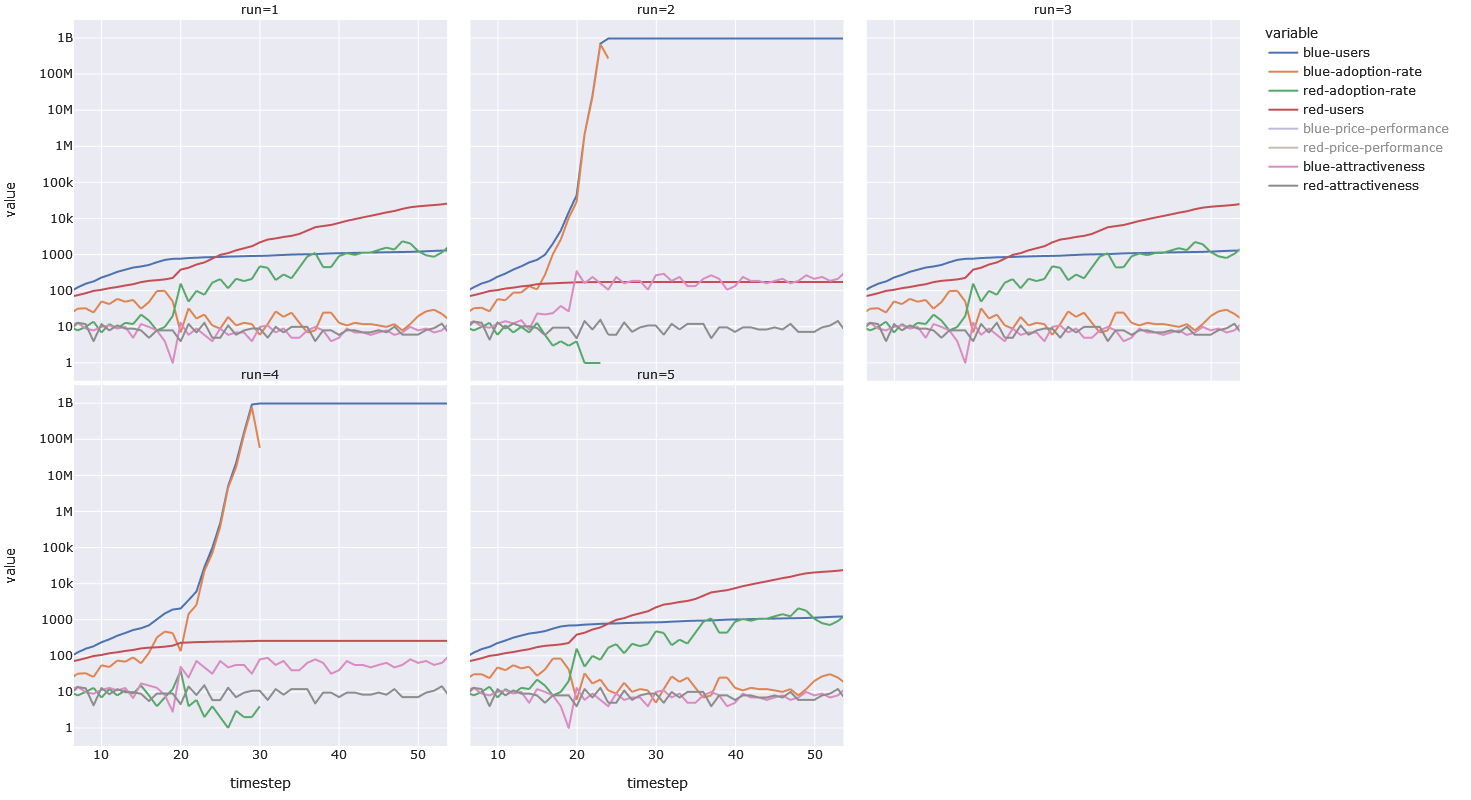
Let us zoom into the first 50 time-steps, to get a better look at those early user numbers. In the base-run Red reaches 1000 before blue, so we would expect Red to win the runs with a threshold of 1000 — but the continuous multiplication helped give Blue the edge and Blue got to 1000 first. In case you are wondering the higher sensitivity value (3 compared to 2), helped Blue reach 1000 users a single timestep before it otherwise would have.
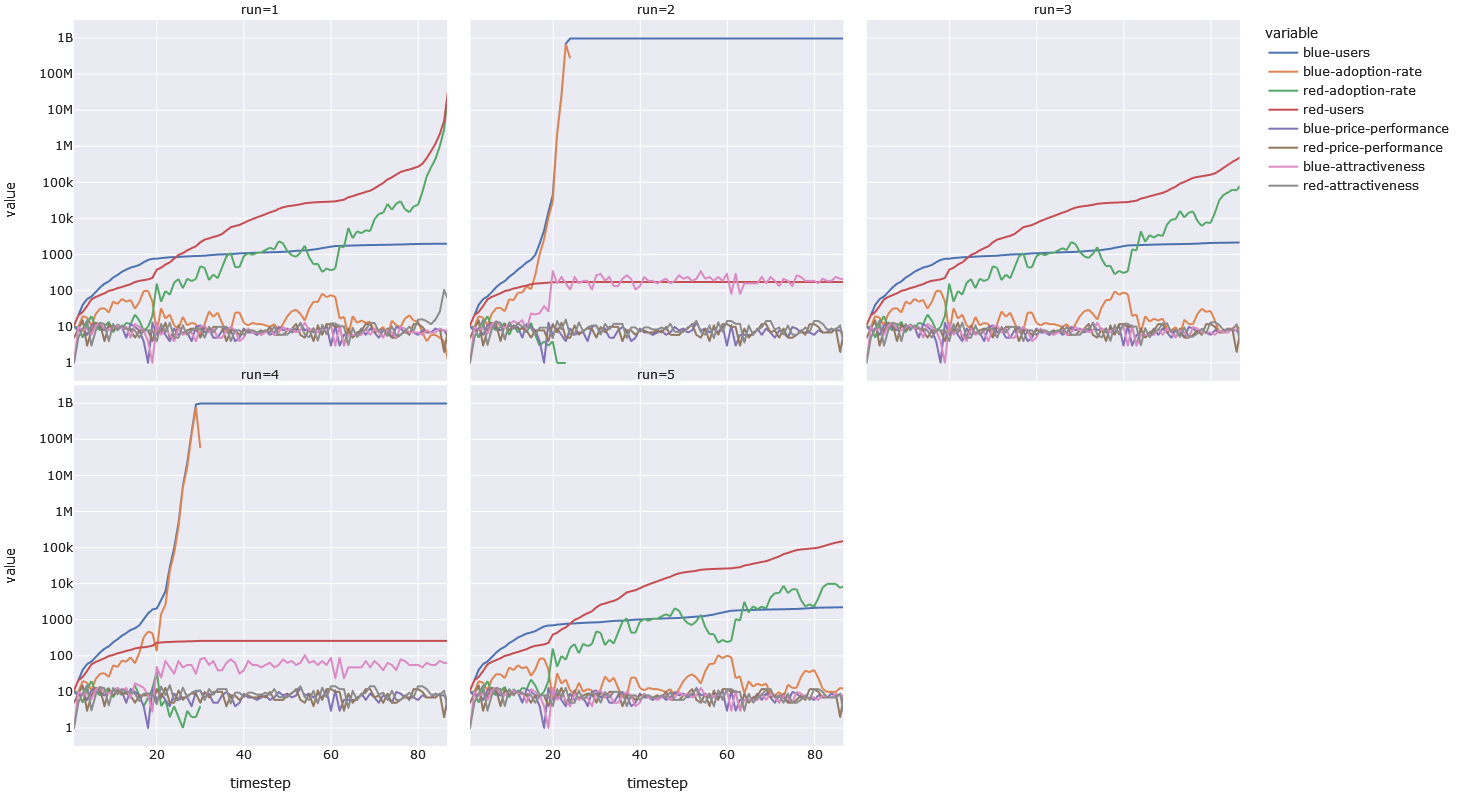
If we zoom in to see how Red won the million-threshold run, we see the following. We can tell the the first run has a higher sensitivity, because Red reached a million users in that run well before it did so in the third run. We also see that, despite not reaching a million users in run three, Red has 3.3 times the number of users than it would have had without network effects, by timestep 87.
The lesson here is that even if you have not attained critical mass, in a system or market with network effects, even a small number of initial users can nudge you towards that tipping-point.
What If Everything?
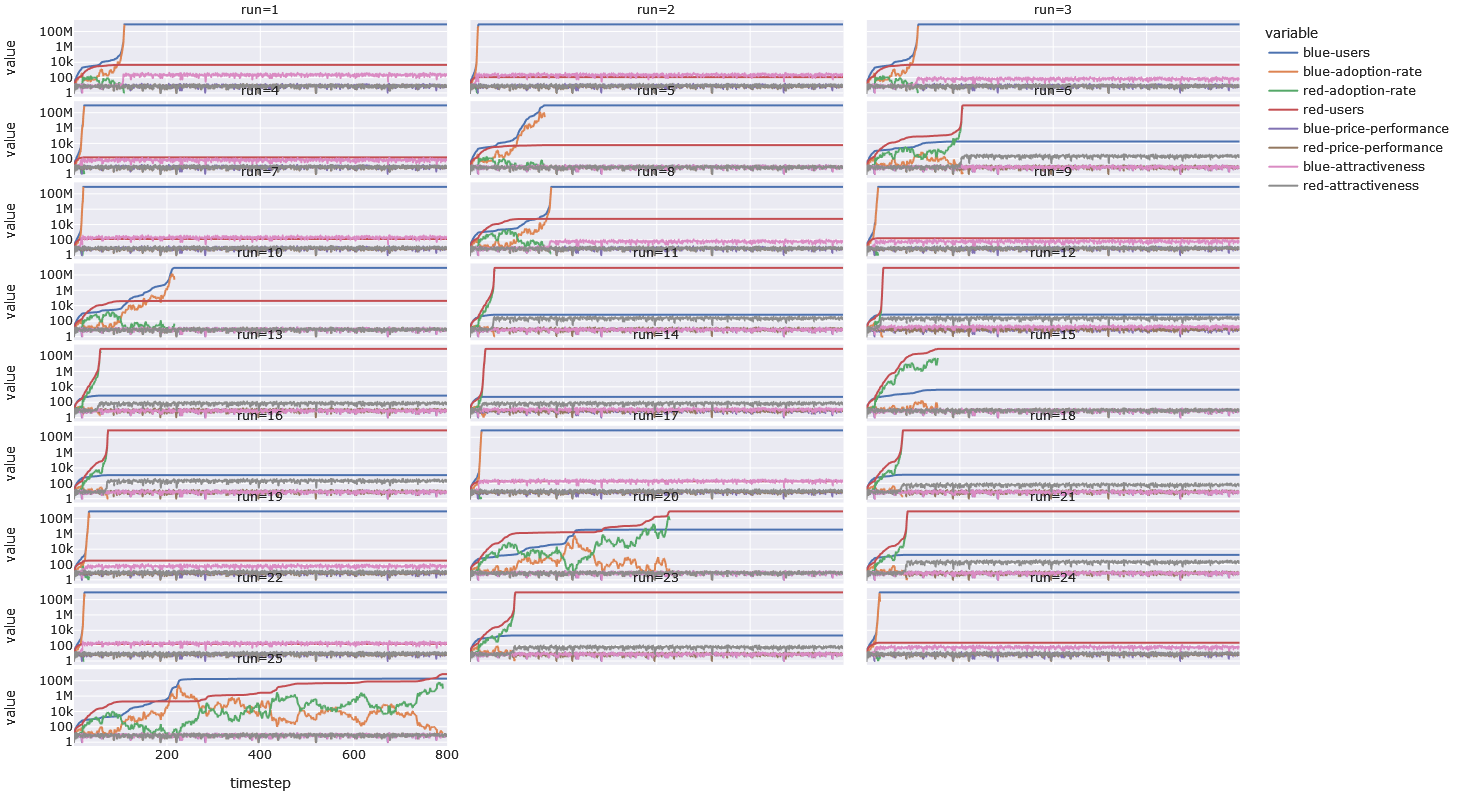
If we run every possible simulation — of which there are 25 — we see a few interesting things. First of all, network-effects can offset a small skill-advantage of 3% — run 6 is an example where Red had no advantage over Blue. The larger advantage of 10%, however, helps the advantaged player reach critical mass more quickly. Run 11 is like run 6, but Red has a 10% advantage over Blue. One can tell which plots lack network effects by looking at the pink and grey lines — if there are no network effects, the value-range of the lines is the same (i.e. they overlap).
A Dialectical Engine
The dialectical method of reasoning, understanding, and learning has been with us since — at least — the time of Plato. A dialectical engine is any kind of method — be it linguistic or symbolic or anything else — that allows us to expand the scope, and deepen the precision, of the dialectic. In the context of the dialectic, computer-assisted modeling is an engine that allows us to ask questions about our mental models of the external world, and to extract answers — which invariably lead to more questions. Perhaps most importantly, the dialectical mindset allows us to discover contradictions between the model and the reality — which in turn help us understand the limits of the model, and the depth of reality.
Questions of Network Effects
The first question has to do with the runs involving network-effects: is it realistic that the "harnessing" of a network effect by Red or Blue will cause a decisive defeat for the opposite side, and effectively end the game?
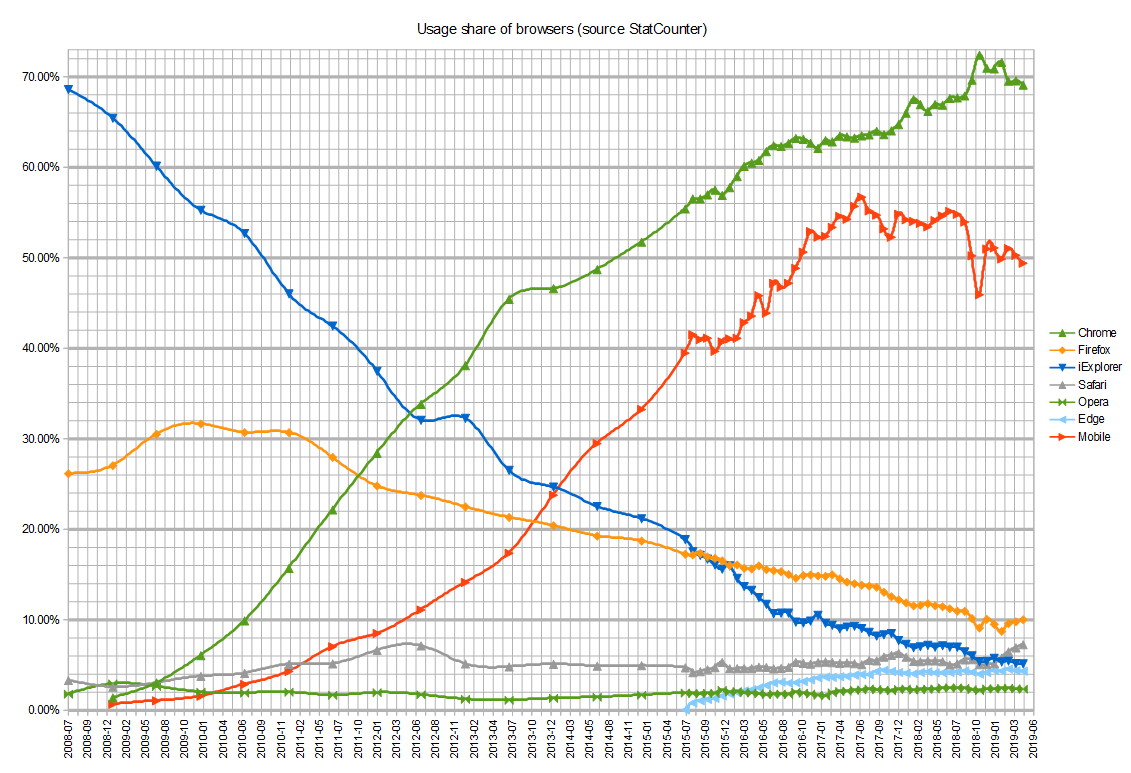
We can come up with various examples and counter-examples. We can point out that, even though Netscape got to the Web first, Microsoft's Internet Explorer eventually displaced it, only to lose one third of its market share to Firefox before eventually losing the remaining 66% to Chrome. This seems to contradict the permanent victory that the model predicts.
However, we should point out that in the first phase, Microsoft was able to leverage the existing Windows user-base to achieve critical mass — in effect, the network effect being leveraged was that of the PC.
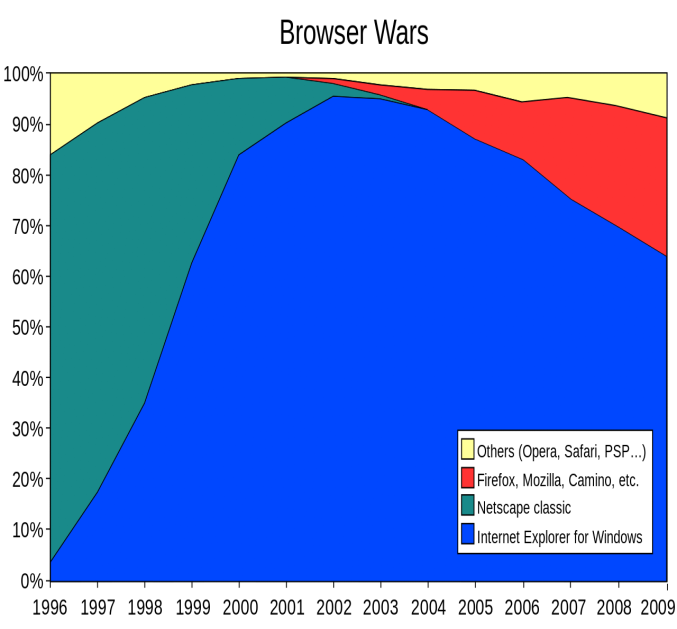
This also helps explain how Chrome displaced the two dominant browsers, Firefox and Internet Explorer. As can be seen in the plot below, the adoption of Chrome closely follows the adoption of Android smartphones.
The only remaining contradiction here is why Firefox was able to take — or regain, if you view Mozilla as a continuation of Netscape — 33% of the market-share from Internet Explorer. We can only speculate that, while Microsoft may have tried to embrace, extend, and extinguish the Web, the existing websites were compatible enough — due to open standards — to allow users to use Firefox with less headaches than would otherwise be possible (i.e. Microsoft had less control over core features and legibility of the HTML format, than it did over the Word Document format). Furthermore, web-page developers and creators are also very influential users, and their presence may have changed the dynamics. In fact, extending the model such that it can approximate the dynamics between writers, readers, and publishers could be more appropriate (Red and Blue are the "publishers" while users would be partitioned into 2 pools of readers and writers).
Since we mentioned Android and iPhone, does the model help explain why Apple — in spite of release the iPhone two years before Android came out — only commands between 14% and 19% of the marketshare between 2012 and 2022?
This is basically a Betamax and VHS scenario. Android consumed 80% of the market for the same reason VHS did — they were both open standards, that allowed any manufacturer with enough interest and money to enter the market. In fact, this model is a better reflection of the rivalry between iPhone and Android, than Betamax and VHS — Betamax was ignored by the consumer market because almost nobody wanted to publish video tapes in that format, whereas Android and iPhone have co-existed for more than a decade. This is due to the model not simulating the loss of existing users. This would suggest that there is some intertia in the real-world smartphone user-base — perhaps Betamax would have survived if they pre-emptively made a large collection of existing popular works available at launch, and if they offered an incrementally more ergonomic user experience.
Questions of Dice Rolls
While network effects may seem self-evident, the use of dice to simulate relative performance may seem questionable. Can we come up with examples that confirm and contradict the dice-roll model?
Even though the histories that we read — even the most recent histories of Silicon Valley — present the events through the lens of individual visions, dreams, plans, and ideas, this does not seem to be an undistorted reflection of what actually happened. Consider, for example, the first Apple computers. While both of the Steves were very clever and motivated people — in their own ways — they were also exceptionally lucky: firstly, they had complementary worldviews and skillsets, and secondly, Wozniak's employer (HP) chose not to claim ownership over the personal-computer concept (even though they had the legal right to do so).
Consider how lucky Microsoft was that they even had the opportunity to trick IBM into an asymmetrically beneficial contract. Consider how unlucky Microsoft was to draw the scrutiny of the federal government, and the resentment of an entire industry. Consider how unlucky both Microsoft and Yahoo were when they chose to arrogantly pass on a bargain-level acquisition of Google.
Most of the industry, in the 1990s, predicted that Apple would never recover and would eventually close its doors — yet here we are. For a more dramatic example, subject-matter experts (and non-experts), predicted — in the 1970s and 1980s — that the Soviet Union was the most stable political entity on the planet, and would last at least another hundred years — they would be proven wrong in a few short decades.
These companies and institutions employ some of the most intelligent people at a very high cost-per-employee — yet no amount of planning prepared them for the most dramatic future developments. It would seem that on a long enough timeline, everything is a dice-roll, and all you can really do is hope for a good roll, and prepare to make the best out of a bad roll.
Consider the Industrial Revolution. Somewhat similar to the gunpowder-artillery example, just as gunpowder was known to the Chinese for half a millenium before it became weaponized, the principle of steam-power was understood by Greeks and Romans for 1.7 millenia before the people of the British Isles started using it to generate motion. And just as the first gunpowder-artillery was very good against the unsophisticated fortifications of Europe, so too did the steam engine prove its utility for pumping water out of coal-mines, creating a demand for it and an incentive to improve it. The luck aspect in both of these circumstances is that the inventions, when enhanced and refined, had unforseeable utility well beyond their initial domains. The people of the British Isles got a very good roll.
The dice-rolls are most beneficial to a team when they roll high, and their opponent rolls low. This suggests that — by the logic of the model — in a competitive situation, it is not enough to be lucky, your opponent also has to be unlucky. In such a narrow, zero-sum game, that 3% or 10% edge could be due to a Team's virtue, or due to a Team's willingeness and ability to sabotage the opponent — the math is the same. If the model only simulated dice (and not network-effects) the following occurrences would be apparent contradictions: open source software, open standards, international academic cooperation, the absence of non-competes in Silicon Valley, and so on. It seems that network-effects — at least partially — explain cooperation.
Strategic Implications
If we take the model at face-value — not that anyone should, it was put together very hastily — what are some strategic lessons that we can derive from it?
If the game has no network-effects, each player should try to give themselves an edge that can soften the blow of a bad roll, and amplify the benefits of a good roll. Even small advantages tend to add up, and can change the result of the game.
If the game has network-effects, try to gain enough users to reach critical mass — this is the trickiest prescription, since we have no clue a-priori what the critical mass threshold even is — if it is extremely high, good luck staying solvent.
If the team fails to harness the network effects, resulting in an irreversable loss of market-share, then the team should probably pivot into a complementary market that can still take advantage of the ongoing exponential growth — instead fighting for a lost cause. Alternatively, the team can try to play a different — but adjacent — game, like Apple did with MP3 players and music in the early 2000s, and smartphones in the late 2000s. This raises an interesting question: what lessons would we draw from an extended model with the same players, playing multiple concurrent (or iterated) games, where success in one game can have cross-over effects in the other games?
Postlude
Just as a sudden burst of intense light can cause blindness in the observer, so too can an explosion of noise cause deafness in the listener. The world is an extremely noisy place, but in that noise, there is a faint, chaotic music, and the players — whether they know it or not — dance to that music. Simulated systems may help us amplify aspects of that tenuously echoing music.
If you enjoyed this piece, please consider subscribing, or sharing it with others using the buttons below.